Technical Analysis for Crypto Trading
Master the art of reading cryptocurrency markets through comprehensive technical analysis techniques
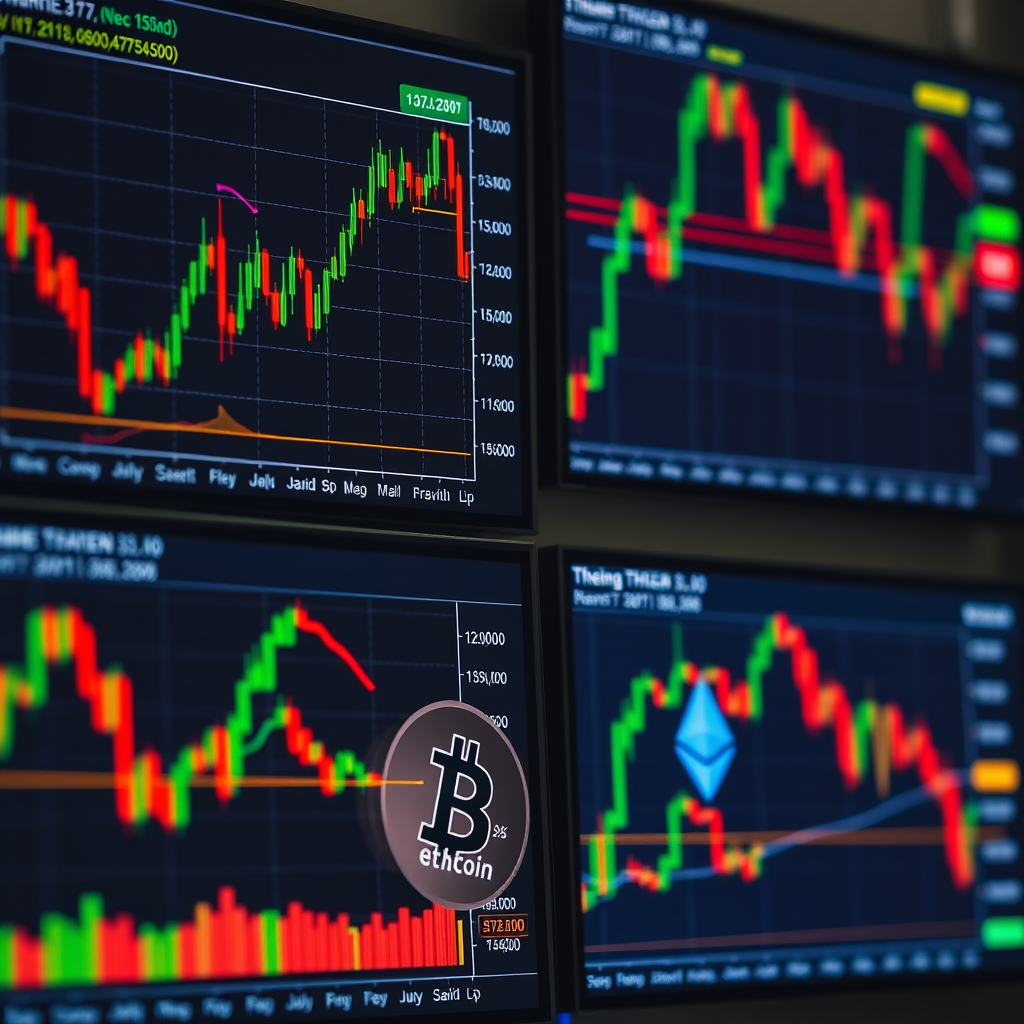
Introduction to Crypto Technical Analysis
Technical analysis is the cornerstone of successful cryptocurrency trading, providing traders with the tools to interpret market behavior and predict future price movements. Unlike traditional markets, crypto markets operate 24/7, creating unique patterns and opportunities that require specialized analytical approaches.
In the volatile world of digital currencies, understanding technical indicators becomes crucial for both short-term traders and long-term investors. This comprehensive guide will equip you with the knowledge to navigate crypto markets using proven technical analysis methods.
Understanding Chart Patterns in Cryptocurrency
Chart patterns form the foundation of technical analysis, revealing market psychology and potential price directions. In cryptocurrency markets, these patterns often appear more pronounced due to higher volatility and emotional trading behavior.
Key Reversal Patterns
- Head and Shoulders: A reliable reversal pattern indicating potential trend changes in major cryptocurrencies
- Double Top/Bottom: Common in Bitcoin and Ethereum, signaling exhaustion of current trends
- Rising/Falling Wedges: Particularly effective in identifying breakout opportunities in altcoins
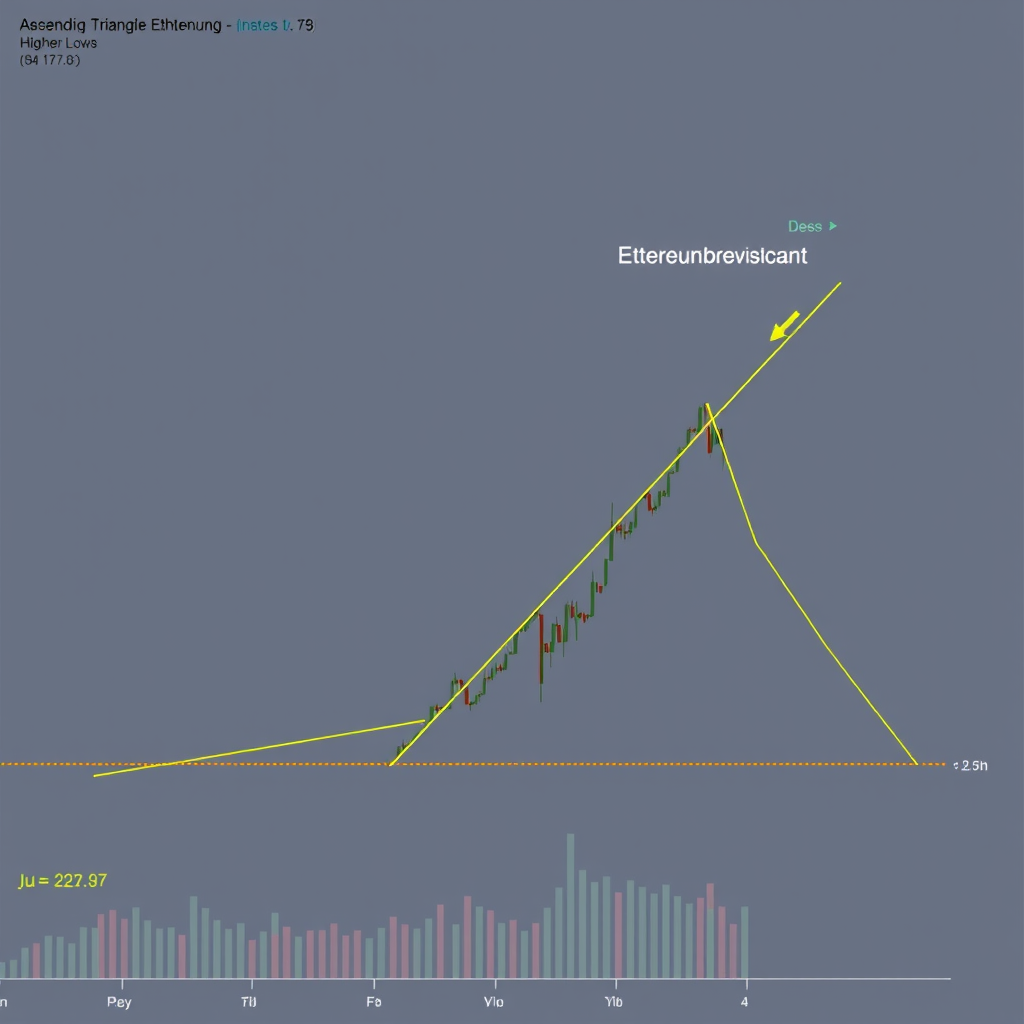
Continuation Patterns
- Triangles: Ascending, descending, and symmetrical triangles frequently appear in crypto charts
- Flags and Pennants: Short-term consolidation patterns common during strong crypto rallies
- Rectangles: Horizontal support and resistance levels creating trading ranges
Mastering Candlestick Formations
Candlestick patterns provide immediate insights into market sentiment and potential price reversals. In cryptocurrency trading, these formations are particularly valuable due to the emotional nature of crypto markets.
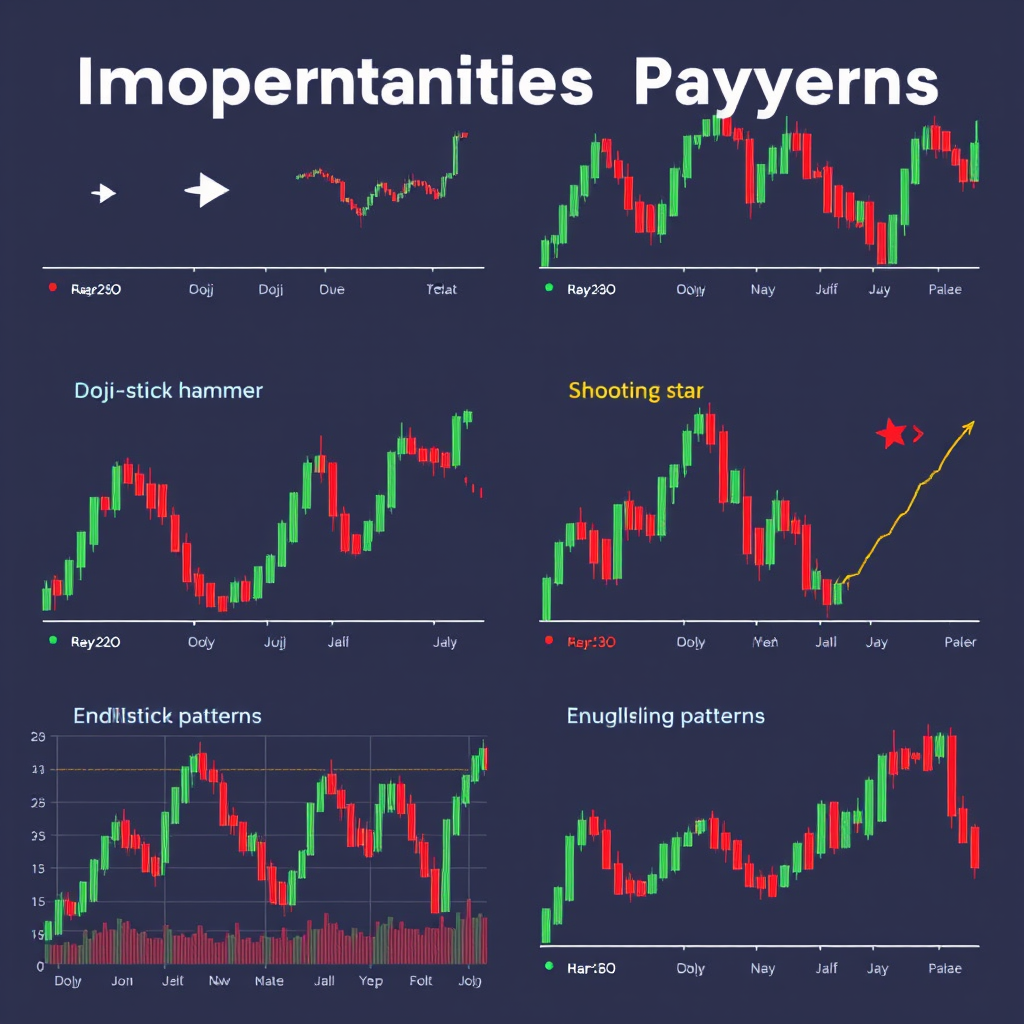
Single Candlestick Patterns
- Doji: Indicates market indecision and potential reversal points
- Hammer: Bullish reversal signal after downtrends
- Shooting Star: Bearish reversal pattern at resistance levels
- Spinning Top: Shows market uncertainty and consolidation
- Marubozu: Strong directional movement with minimal wicks
- Dragonfly Doji: Potential bullish reversal at support levels
Multiple Candlestick Patterns
These patterns require two or more candles to form and often provide stronger signals:
- Engulfing Patterns: Powerful reversal signals when larger candles engulf previous ones
- Morning/Evening Stars: Three-candle reversal patterns highly effective in crypto markets
- Harami Patterns: Inside bar formations indicating potential trend changes
Support and Resistance Levels
Support and resistance levels are fundamental concepts in technical analysis, representing price levels where buying or selling pressure historically emerges. In cryptocurrency markets, these levels often coincide with psychological price points and previous significant highs or lows.
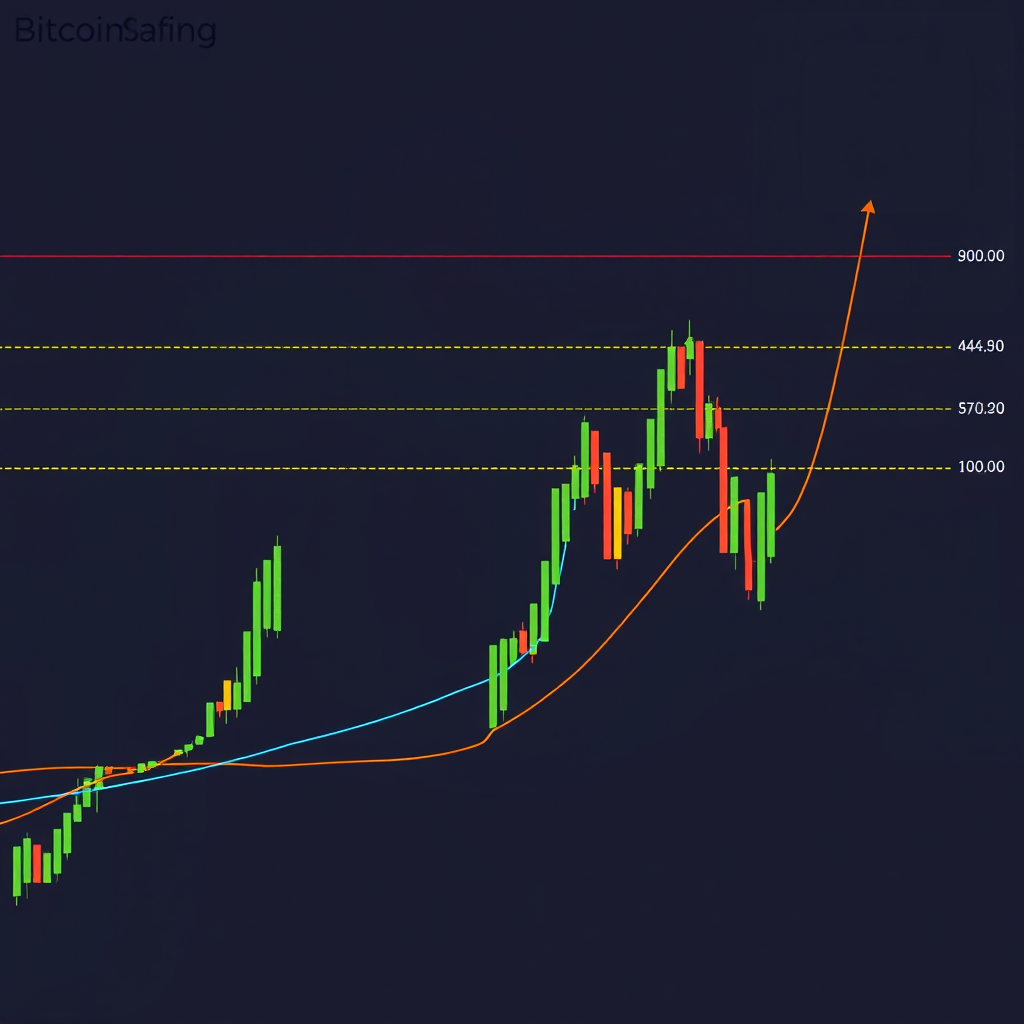
Identifying Key Levels
- Historical Price Points: Previous highs and lows that acted as turning points
- Round Numbers: Psychological levels like $50,000 for Bitcoin or $4,000 for Ethereum
- Moving Average Levels: Dynamic support and resistance from key moving averages
- Volume Nodes: Price levels with high trading volume indicating strong interest
Trading Strategies
Effective approaches for trading support and resistance:
- Bounce Trades: Buying at support or selling at resistance with tight stops
- Breakout Trading: Entering positions when price breaks through key levels with volume
- Role Reversal: Trading when support becomes resistance or vice versa
Essential Technical Indicators
Technical indicators transform raw price data into actionable insights, helping traders identify trends, momentum, and potential reversal points. For cryptocurrency trading, certain indicators prove particularly effective due to the unique characteristics of digital asset markets.
Moving Averages
Moving averages smooth price action and reveal underlying trends, making them indispensable for crypto analysis:
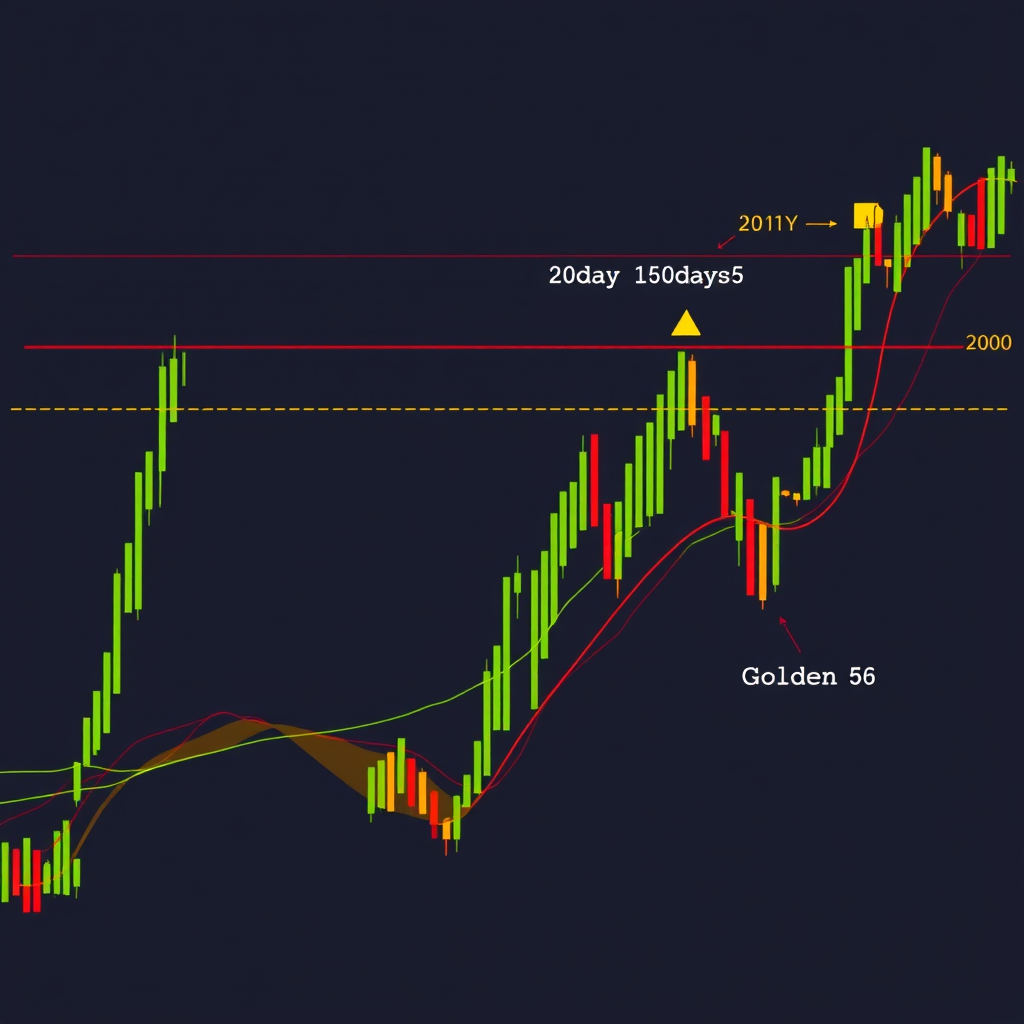
- Simple Moving Average (SMA): Equal weight to all periods, ideal for identifying long-term trends
- Exponential Moving Average (EMA): More weight to recent prices, responsive to current market conditions
- Golden Cross: When 50-day MA crosses above 200-day MA, signaling potential bull market
- Death Cross: When 50-day MA crosses below 200-day MA, indicating possible bear market
Relative Strength Index (RSI)
RSI measures momentum and identifies overbought/oversold conditions in crypto markets:
- Overbought Levels: RSI above 70 suggests potential selling pressure
- Oversold Levels: RSI below 30 indicates possible buying opportunities
- Divergences: When price and RSI move in opposite directions, signaling potential reversals
- Centerline Crossovers: RSI crossing 50 confirms trend direction changes
MACD (Moving Average Convergence Divergence)
MACD combines trend-following and momentum characteristics, making it valuable for crypto analysis:
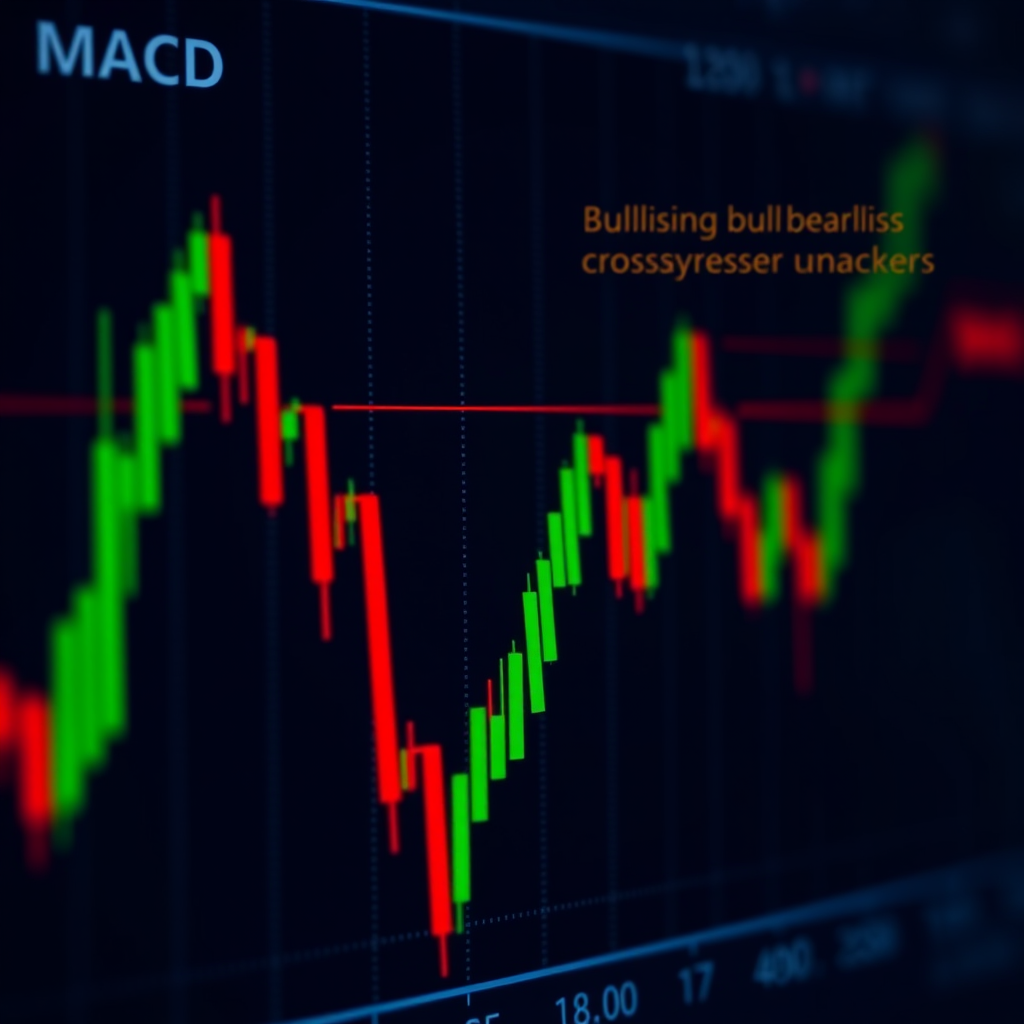
- Signal Line Crossovers: MACD crossing above signal line suggests bullish momentum
- Zero Line Crossovers: MACD crossing zero confirms trend direction
- Histogram Analysis: Increasing histogram shows strengthening momentum
- Divergence Patterns: MACD diverging from price indicates potential trend changes
Advanced Technical Analysis Techniques
Beyond basic indicators, advanced techniques provide deeper market insights and help identify high-probability trading opportunities in cryptocurrency markets.
Volume Analysis
Volume confirms price movements and reveals market conviction:
- Volume Confirmation: Strong price moves should be accompanied by high volume
- Volume Divergence: Decreasing volume during price advances warns of potential reversals
- Breakout Volume: High volume breakouts are more likely to sustain
- Accumulation/Distribution: Volume patterns reveal institutional activity
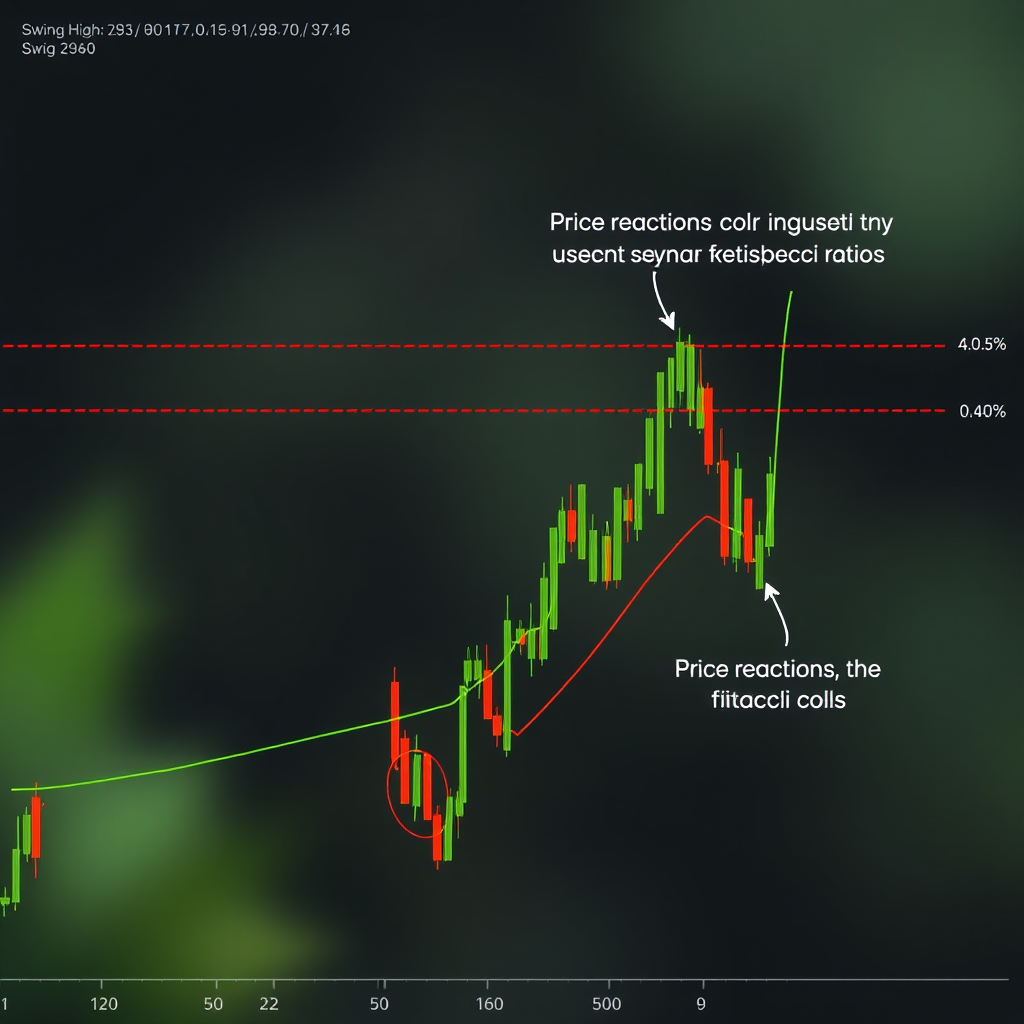
Fibonacci Retracements
Fibonacci levels help identify potential support and resistance areas:
- Key Retracement Levels: 38.2%, 50%, and 61.8% often act as support/resistance
- Extension Levels: 127.2% and 161.8% project potential price targets
- Multiple Timeframe Analysis: Confluence of Fibonacci levels across timeframes
Developing Your Trading System
Successful crypto trading requires a systematic approach that combines multiple technical analysis tools into a coherent strategy. Building a robust trading system helps eliminate emotional decisions and improves consistency.
Multi-Timeframe Analysis
Analyzing multiple timeframes provides comprehensive market perspective:
- Long-term Trend: Use daily and weekly charts to identify primary trend direction
- Entry Timing: Use hourly and 4-hour charts for precise entry points
- Confirmation: Ensure all timeframes align before taking positions
- Risk Management: Set stops based on longer timeframe support/resistance
Risk Management Principles
Protecting capital is paramount in volatile crypto markets:
- Position Sizing: Never risk more than 2-3% of capital per trade
- Stop Losses: Always define exit points before entering trades
- Risk-Reward Ratios: Target minimum 1:2 risk-reward ratios
- Diversification: Spread risk across multiple cryptocurrencies
Market Psychology and Sentiment Analysis
Understanding market psychology is crucial for successful crypto trading. Technical analysis not only reveals price patterns but also reflects the collective emotions and behaviors of market participants.
Fear and Greed Cycles
Cryptocurrency markets are particularly susceptible to emotional extremes:
- Extreme Fear: Often marks excellent buying opportunities near market bottoms
- Extreme Greed: Typically coincides with market tops and distribution phases
- Contrarian Approach: Going against crowd sentiment often yields better results
- Sentiment Indicators: Use fear and greed index alongside technical analysis
News Impact on Technical Patterns
Fundamental events can accelerate or invalidate technical patterns:
- Regulatory News: Can cause immediate breakouts or breakdowns
- Adoption Announcements: Often trigger bullish pattern completions
- Security Breaches: May accelerate bearish technical formations
- Market Correlation: Consider broader market sentiment and Bitcoin dominance
Practical Application and Next Steps
Mastering technical analysis requires consistent practice and continuous learning. Start with basic concepts and gradually incorporate more advanced techniques as your understanding deepens.
Getting Started
- Paper Trading: Practice strategies without risking real capital
- Chart Analysis: Spend time studying historical price movements
- Pattern Recognition: Train your eye to spot recurring formations
- Backtesting: Test strategies on historical data before live trading
Continuous Improvement
- Trading Journal: Document all trades and analyze performance
- Market Review: Regularly review and adjust your approach
- Education: Stay updated with new techniques and market developments
- Community: Learn from experienced traders and share insights
Pro Tip
Remember that technical analysis is a probability-based approach, not a crystal ball. No single indicator or pattern guarantees success. Combine multiple tools, manage risk carefully, and always be prepared for unexpected market movements in the dynamic world of cryptocurrency trading.